I. Key Topic
Agile contracting, Agile project accounting principles, Agile risk management, Agile tooling Compliance/regulatory compliance
- ROI/NPV/IRR
- Earned value management (EVM ) for agile projects
- Cumulative flow diagrams (CFDs)
- Customer-valued prioritization
- Frequent verification and validation, Incremental delivery
- Managing with agile KPIs
- Minimal viable product (MVP)
- Minimal marketable feature (MMF)
- Prioritization schemes: Kano analysis, MoSCoW, Relative prioritization/ ranking, L-time acceptance criteria
- Software development practices
- Continuous integration
- Exploratory and usability testing
- Red, Green, Refactor
- TDD/TFD/ATDD, Task/ Kanban boards, Value-driven delivery
- Work in progress (WIP), WIP limits
What is Value driven

When faced with a decision, they ask, “Which choice will add the most value for the customer?” The focus on delivering value drives many of the activities and decisions on an agile project and is the ultimate goal of many of the practices in the agile toolkit.
Deliver Value Early
One of the key ways agile teams try to maximize value is by delivering value early. First, life is short, stuff happens, and the longer a project runs, the longer the horizon becomes for risks that can reduce value such as failure, decreased benefits, erosion of opportunities, and so on. The second major reason for focusing on early delivery of value is that stakeholder satisfaction plays a huge role in project success.
Financial Assessment Metrics
Return on Investment (ROI) measures the profitability of an investment by calculating the ratio of the benefits received from the investment to the money invested in it. ROI is expressed as a percentage, and the higher that percentage, the better the return that the project is expected to deliver.
ROI = The ratio of the benefits received from an investment to the money invested in it, expressed as a percentage.
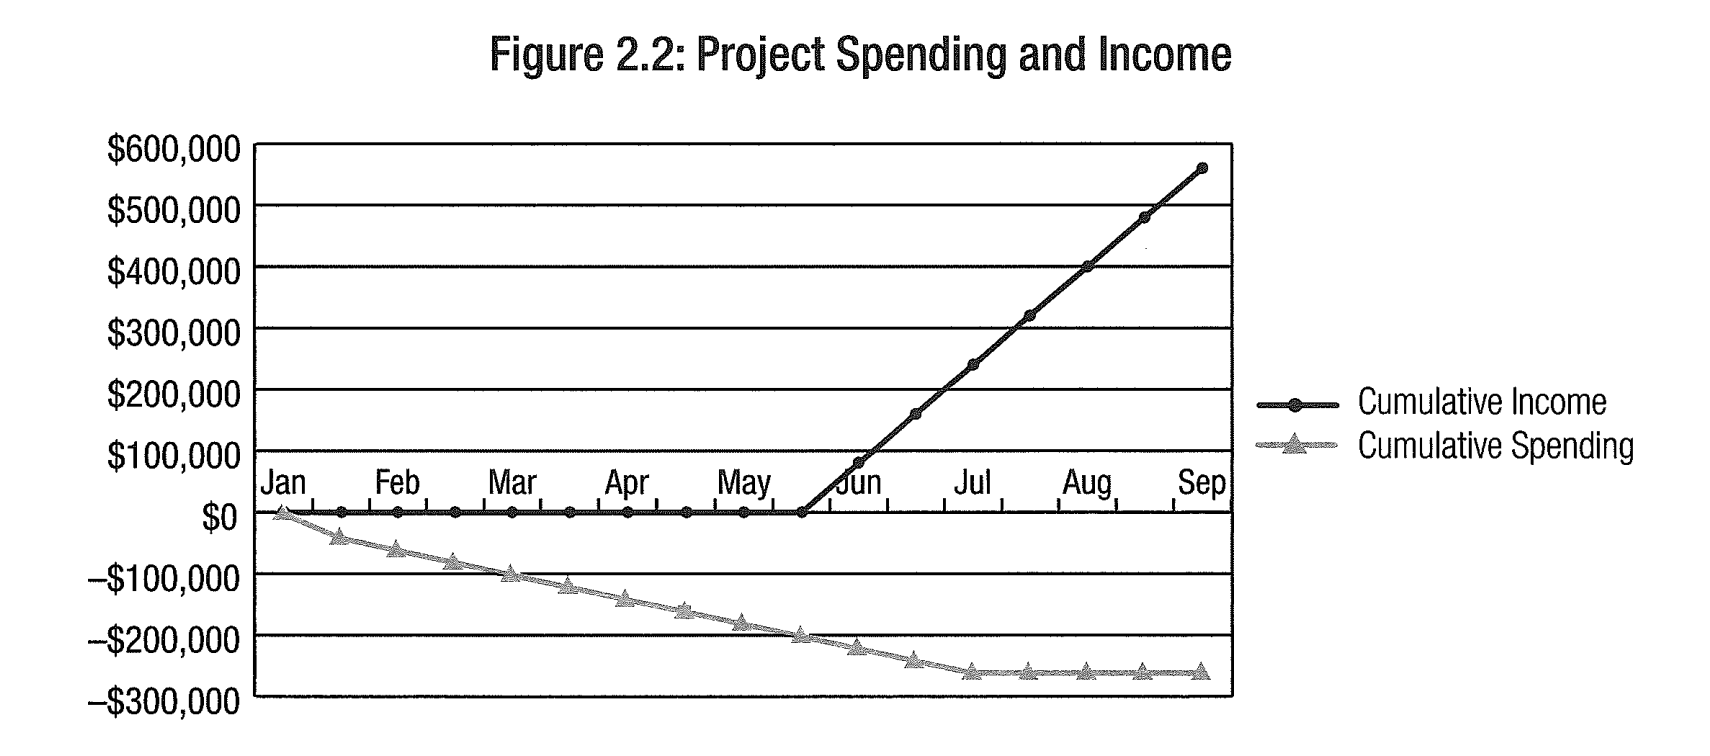

When do you think our total return will equal our total investment?
It is tempting to assume that our return will equal our investment in July, when our net cash flow reaches zero.
Present Value
Present value is a way of calculating the value of a future amount in todays terms, given an assumed interest rate and inflation rate.

Net Present Value (NPV)
We can extend the concept of present value to find the present value of the return expected for a project. This metric is called net present value, or NPV, and it can be defined as follows:
NPV = The present value of a revenue stream (income minus costs) over a series of time periods.
Generally, any project that has a positive NPV is a good investment, since we will make back more money than we have invested in todays terms. However, if were using NPV to compare the value expected from multiple potential projects, then the higher the NPV, the better.
In large multiyear projects, the true payback period can be substantially longer, especially if the money to invest in these projects is borrowed at high interest rates. NPV can be especially helpful for comparing projects that involve different timeframes or that are expected to start delivering value at different times
Internal rate of return (IRR)
The official definition of IR R is the discount rate at which "the project inflows (revenues) and project outflows (costs) are equal.”5 Another way of stating this is to ask, “What is the discount rate that would move the payback period to the end of the project?”
IRR = The discount rate at which the project inflows (revenues) and project outflows (costs) are equal.
This metric helps simplify the evaluation of projects, since we don’t have to guess what the future interest and inflation rates will be, as we do for NPV. Rather than using projected interest and inflation rates to calculate the value of a project in today’s terms, we use our estimates of project duration and payback to calculate an effective interest rate (aka “discount rate”) for the project.
Exam TIP:
Note: It isn’t meaningful to compare ROI, NPV, and IRR rates to each other. If the answers to an exam question include more than one of these metrics, don’t just pick the option with the highest rate; instead, read the question carefully to determine which metric is relevant to the situation being described.
Earned Value Management (EVM)


The above diagram shows how traditional EVM metrics such as schedule performance index (SPI) and cost performance index (CPI) can be translated into agile terms. For example:
- We planned to complete 30 story points in the last iteration, but we only completed 25 points. To find our SPI, we divide 25 by 30 for an SPI of 0.83. This tells us that we are working at only 83 percent of the rate planned.
- CPI is the earned value (EV, or value of completed features) to date divided by the actual costs (AC) to date. So in the above diagram, CPI = $2,200,000 / $2,800,000 = 0.79. This means we are only getting 79 cents on the dollar compared to what we had predicted.
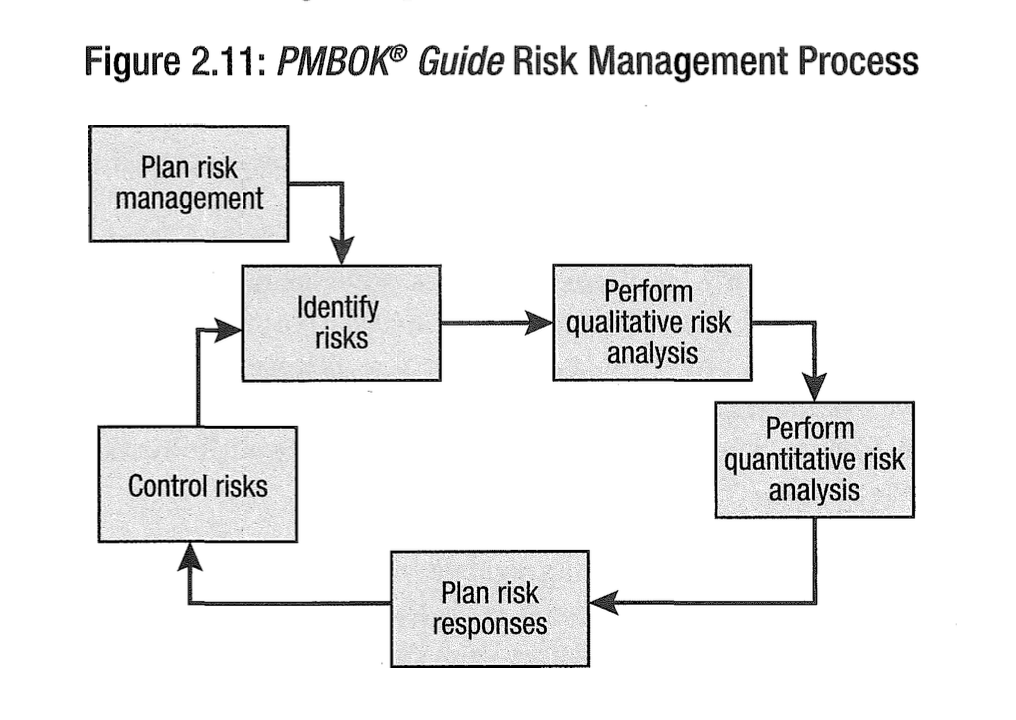
Risk Management
The primary tools that agile teams use to manage risk are the risk-adjusted backlog and risk burn down charts.
Customer-Valued Prioritization*
In these sessions, we ask, “Have things changed?” and “Do we still want to move on to item X next?”After discussion, the new and evolving priorities are captured in the backlog, to be revisited again at the next planning session.
Prioritization Schemes
MoSCoW
The MoSCoW prioritization scheme, which was popularized by DSDM, derives its name from the first letters of the following labels:
- Must have requirements or features are those that are fundamental to the system; without them, the system will not work or will have no value.
- Should have features are important— by definition, we should have them for the system to work correctly. If they are not there, then the workaround will likely be costly or cumbersome.
- Could have features are useful net additions that add tangible value.
- Would like to have, but not this time
Monopoly Money Give the stakeholders Monopoly money equal to the amount of the project budget and ask them to distribute those funds amongst the system features.
100-Point Method Each stakeholder is given 100 points that he or she can use to vote for the most important requirements. The stakeholders can distribute the 100 points in anyway: 30 points here, 15 points there, or all 100 points on a single requirement, if that is the stakeholder s only priority.
Dot Voting or Multi-Voting
This is another technique in which collective wisdom emerges through individual priorities. Here, each stakeholder gets a predetermined number of dots (or check marks, sticky stars, etc.) to distribute among the options presented. When deciding how many votes to give each person, a good rule of thumb is 20 percent of the total number of items.
The facilitator then sums the votes for each item and creates a ranked list based on how many votes each item received. The voting can be public, or it can be private with someone tallying the totals off-line to prevent power struggles and strategic voting.
Kano Analysis

Delighters / Exciters:These features deliver unexpected, novel, or new high-value benefits to the customer.
**Satisfiers:**For features that are categorized as satisfiers, the more the better.These features bring value to the customer.
Dissatisfiers: These are things that will cause a user to dislike the product if they are not there, but will not necessarily raise satisfaction if they are present. Indifferent: These features have no impact on customers one way or another. Since customers are indifferent to them, we should try to eliminate, minimize, or defer them.
Relative priority list

In the diagram above, each feature is listed in order o f priority. The items at the top o f the list— features A through D — are part of the defined minimal viable product. If scope needs to be cut to meet the budget and schedule objectives, its clear by looking at this simple list that adjustments should be made to item E.

Delivering Incremental

With incremental delivery, the team regularly deploys working increments of the product over the course of the project. In the case of software development projects, the working software is usually deployed to a test environment for evaluation. As shown in the cost of change curve below, issues that are found in software deployed in a test environment for evaluation (point l ) are much cheaper to fix than issues found during production (point 2)
Minimal Viable Product (MVP)
The term “minimal viable product,“ or MVP (also known as “minimal marketable feature,” or MMF) refers to this package of functionality that is complete enough to be useful to the users or the market, yet still small enough that it does not represent the entire project.7
Work in Progress (WIP)
“Work in process” or even “work in play’ is the term given to work that has been started but has not yet been completed.
Limit WIP
Limiting W IP helps identify bottlenecks and maximize throughput on a project; just like limiting the number of cars on a road helps traffic flow faster.
Cumulative Flow Diagrams (CFDs)
Cumulative flow diagrams (CFDs) are valuable tools for tracking and forecasting the delivery of value.


We do not need to micromanage team throughput to determine where the bottlenecks are. Instead, by using CFDs to track progress, we can identify bottlenecks unobtrusively. Then, once we know where the problem is, we can start addressing the issue by applying the Five Focusing Steps of Goldratt’s Theory of Constraints, starting with step:
- Identify the constraint.
- Exploit the constraint.
- Subordinate all other processes to exploit the constraint.
- If after steps 2 and 3 are done, more capacity is needed to meet demand, elevate the constraint.
- If the constraint has not moved, go back to step 1, but don’t let inertia (complacency) become the systems constraint.
Agile Contracting Vendors are stakeholders who are external to the organization but are involved in the project because they are providing some kind of product or service

TDD


Refer: Printing PMI ACP Exam
Nhận xét
Đăng nhận xét